
What are flood maps and why are they important?
Alex Simmons
Monday 31 July 2023
What are flood maps?
Flood maps are the final product of flood mapping studies, and the basis for managing flood risks. For example, flood maps help:
assess the risks of any proposed development;
create a platform for planning scheme amendments;
assess mitigation and emergency management planning;
assess emergency response and community education needs, and;
inform insurance premiums.
Flood maps have four separate categories; depth, height, velocity and hazard (z0). Each map helps assess a different component of floods, most importantly; flood extents, potential damage, potential casualties, risk, and hazard. As a result, if flood maps are out-of-date, there may be significant consequences to the community.
Flood Depth Mapping
Flood depth maps represent the predicted maximum depth (in metres) of flooding at any given location. This type of mapping in Victoria, Australia, measures property development against the 1% AEP (Annual Exceedance Probability) Flood Event.
Importantly, the size of topographic grids impacts flood depth maps. For example, if a Digital Elevation Model (DEM) or Light Detection and Ranging (LiDAR) dataset has grid sizes of 1 – 10 metres, a constant depth is assumed in the flood model. In reality, depths are likely to vary within a 10 metre square space, or in other words, there are very few parcels of natural land that are completely and utterly flat.
In Victoria, the flood depth is assessed with a set of specific classifications, shown in Table 1 below.
Table 1: Safety Criteria for Development
Type | D Max (m) | V Max (m/s) | VD max (m2/s) |
|---|---|---|---|
New single dwelling on vacant block | 0.5 | 2.0 | 0.4 |
Replacement dwelling >20 sq.m. Dwelling extension >20 sq.m. | 0.5 | 2.0 | 0.4 |
Additional dwelling Dependent person’s unit Group accommodation Residential building Residential village Retirement village Basement | 0.3 | 2.0 | 0.3 |
Camping and caravan parks: – Permanent sites – other sites | 0.3 0.5 | 2.0 2.0 | 0.3 0.4 |
Industrial building, office, place of assembly, retail building, or warehouse | 0.5 | 2.0 | 0.4 |
Child care or education building (other than schools) | 0.3 | 2.0 | 0.3 |
Agricultural buildings* | 0.5 | 2.0 | 0.4 |
Sheds and outbuildings (other than agricultural buildings) and car parking* | 0.5 | 2.0 | 0.4 |
*Check out the Guidelines for Development in Flood Affected Areas for more information.
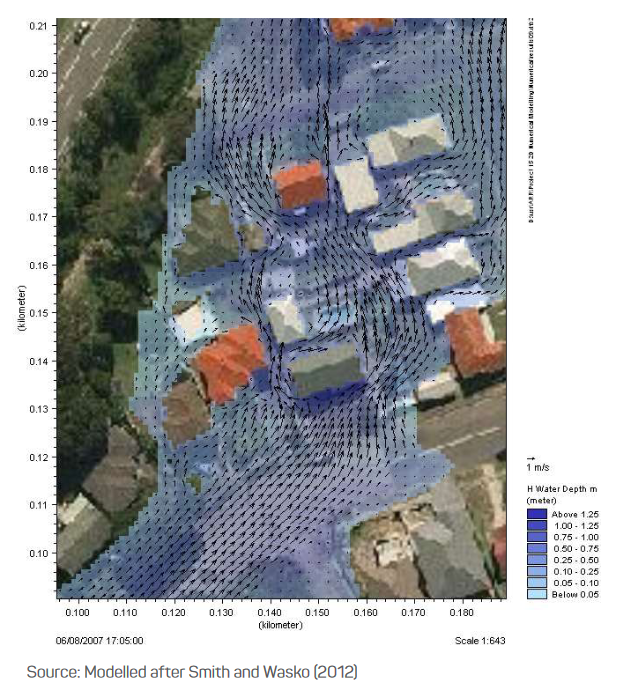
Flood Velocity Maps
Flood velocity maps represent the maximum velocity (or speed of the water) in flooding at any given location. This is measured by metres per second (m/s). In Victoria, a maximum flow velocity guideline of 2.0 m/s has been adopted for site and access safety. Therefore, any development that is proposed in an area with flood velocities exceeding 2.0 m/s is unlikely to be approved.
Flood Height Maps
Flood height maps represent the maximum height (in metres above height datum (mAHD)) of flooding at any given location. It primarily informs the hydraulic structure process of flood modelling. For instance, as a floodplain engineer, I would use the flood height to:
stipulate the level (mAHD) of fill (e.g. soil) required on site;
determine the level of a bridge or hydraulic structure, and/or;
help calibrate a hydrologic or hydraulic model.
The differences in estimated flood heights creates a basis in order to determine the impacts of new structures (i.e. their location and size). For example, to determine the impact of a proposed bridge over the Wannon River in Western Victoria, two model scenarios are run. An original flow “without the bridge” is layered over a run “with the bridge” which enables the visual comparison of two flood heights. This determines a now wet/once dry and now dry/once wet map, as well as a flood height difference map, and helps inform the decision of whether the bridge will go ahead or not.
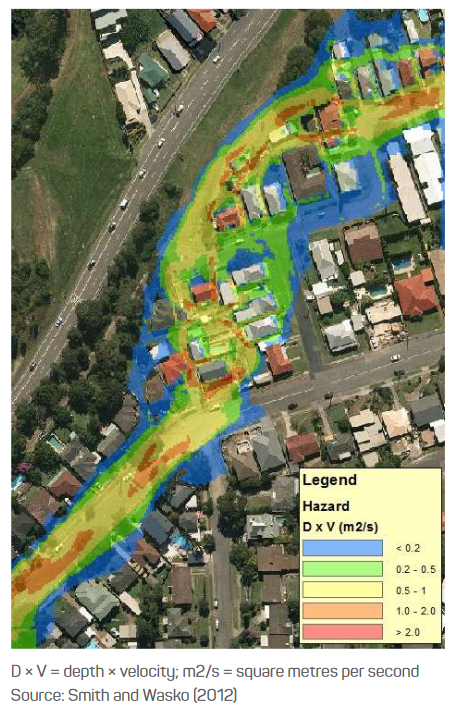
Flood Hazard Maps
Flood hazard mapping assists with identifying hazards, assessing flood risks and providing insights into mitigation actions. The Flood Hazard is the combination of flood depth and flood velocity at any given point. The degree of hazard varies with the severity of flooding and is affected by flood behaviour (extent, depth, velocity, isolation, rate of floodwater rise, duration), topography and emergency management.
Table 2: Hazard Vulnerability Classification
Hazard Vulnerability Classification | Description |
|---|---|
H1 | Generally safe for vehicles, people and buildings. |
H2 | Unsafe for small vehicles. |
H3 | Unsafe for vehicles, children and the elderly. |
H4 | Unsafe for vehicles and people. |
H5 | Unsafe for vehicles and people. All building types vulnerable to structural damage. Some less robust building types vulnerable to failure. |
H6 | Unsafe for vehicles and people. All building types considered vulnerable to failure. |
In Australia, flood hazard is separated into 6 Hazard Vulnerability classifications, as shown in Table 2 and Table 3. In flood studies and assessments, it is recommended that, as a minimum, flood hazard mapping be produced for the design flood event (DFE) i.e. the 1% AEP Flood Event, a flood smaller than the DFE i.e. the 10% AEP Flood Event, and the probable maximum flood or a representative extreme event (Australian Disaster Resilience Handbook, Guideline 7-3, 2017).
Table 3: Hazard Classification and specific parameters
Hazard Vulnerability Classification | Classification limit (D and V combination) m2/s | Limiting still water depth (D) m | Limiting velocity (V) m/s |
|---|---|---|---|
H1 | D*V < 0.3 | 0.3 | 2.0 |
H2 | D*V <= 0.6 | 0.5 | 2.0 |
H3 | D*V <= 0.6 | 1.2 | 2.0 |
H4 | D*V <= 1.0 | 2.0 | 2.0 |
H5 | D*V <= 4.0 | 4.0 | 4.0 |
H6 | D*V > 4.0 | – | – |
Conclusions
Flood mapping projects are essential in determining flood risks and flood hazards in your area. If you are in an area that is subject to flooding and want to know more about your flood maps, contact us here. If you are planning on building fences in floodplains, check out our resource here.
Flood mapping studies require a large investment from Government. Due to limited funding, there is a lack of flood maps in rural areas. Furthermore, existing flood maps may now be out-of-date. In our next blog we will discuss “Are Flood maps out-of-date? and what does that mean for your property value?”
Further Information
Flood Maps for Victoria
North Central Catchment Management Authority
Goulburn Broken Catchment Management Authority
Corangamite Catchment Management Authority
Wimmera Catchment Management Authority
References
National Flood Insurance Program: Flood Hazard Mapping; 2020, Official website of the Department of Homeland Security, https://www.fema.gov/national-flood-insurance-program-flood-hazard-mapping
Flood Hazard, Australian Disaster Resilience Handbook Collection – Guideline 7-3, 2017, Australian Institute for Disaster Resilience, https://knowledge.aidr.org.au/media/3518/adr-guideline-7-3.pdf